A/B Testing
What is A/B Testing?
A/B testing lets you compare two versions of a Cancel Flow to see which one performs better. Churnkey splits your traffic between a control variant (your current flow) and a test variant (your modified flow), then measures which one saves more customers and generates more revenue.
The 5 Lifecycle States
Every A/B test moves through five states:
- Not Started — Test created, waiting for you to start
- Enrolling (1–4 weeks) — Traffic splits between Control and Test
- Tracking (30 days) — Measuring if saved customers actually stay
- Awaiting Decision — Data complete, waiting for you to pick a winner
- Completed — Winner declared, test archived
Total timeline: 37–58 days (1–4 weeks enrollment + 30 days tracking)
State 1: Not Started
| What's happening | Test is created but not running yet |
| Duration | Until you click "Start" |
| Your action | Verify both variants are ready, then start the test |
| Data collected | None |
This state gives you time to review your test variant in the Cancel Flow builder and ensure everything is configured correctly before going live.
State 2: Enrolling (1–4 weeks)
| What's happening | New cancel sessions are split 50/50 between Control and Test |
| Duration | 1–4 weeks (you choose during setup) |
| Your action | Wait. Do not edit variants during this phase |
| Data collected | Session counts, initial save rates |
During enrollment, every customer who enters your Cancel Flow is randomly assigned to one variant. This assignment stays consistent if they return later.
You choose the enrollment duration when creating your test from four presets: 1 week, 2 weeks, 3 weeks, or 4 weeks. Churnkey recommends a duration based on your flow's weekly session volume to ensure enough data for statistical significance. See Choosing an Enrollment Period for guidance.
When enrollment ends, the cohort is locked. No new sessions enter the test after the enrollment period.
State 3: Tracking (30 days)
| What's happening | No new enrollments. Monitoring if "saved" users actually stay |
| Duration | 30 days (fixed) |
| Your action | Wait. This phase validates real retention |
| Data collected | Retention rates, reactivation, LTV impact, revenue per exposure |
Why this phase matters: When a customer accepts an offer (pause, discount), we mark them as "saved" but we don't know yet if they actually stayed. They might cancel again next week, skip their next invoice, or churn silently.
The 30-day tracking window captures the real outcome by measuring whether saved customers pay their next invoice and remain subscribed.
State 4: Awaiting Decision
| What's happening | All data is in. Time to pick a winner |
| Duration | Until you decide |
| Your action | Review results and declare a winner |
| Data available | Statistical confidence, save rate lift, revenue difference, ARR impact |
Look at the statistical confidence level to know how trustworthy your results are:
| Confidence | What it means |
|---|---|
| 95%+ | Strong evidence. Safe to declare a winner |
| 80-95% | Moderate evidence. Proceed with caution |
| Below 80% | Weak evidence. Results may be due to chance |
State 5: Completed
| What's happening | Winner declared, test is finished |
| Duration | Permanent |
| Your action | None. The winning variant is now live |
| Data available | Final results archived for reference |
When you confirm your decision, the winning variant becomes active and the losing variant is deactivated. All future customers in this segment see the winner.
Setting Up a Test
Prerequisite: A/B tests can only run on segmented Cancel Flows, not on your primary (default) Cancel Flow.
| Step | What to do |
|---|---|
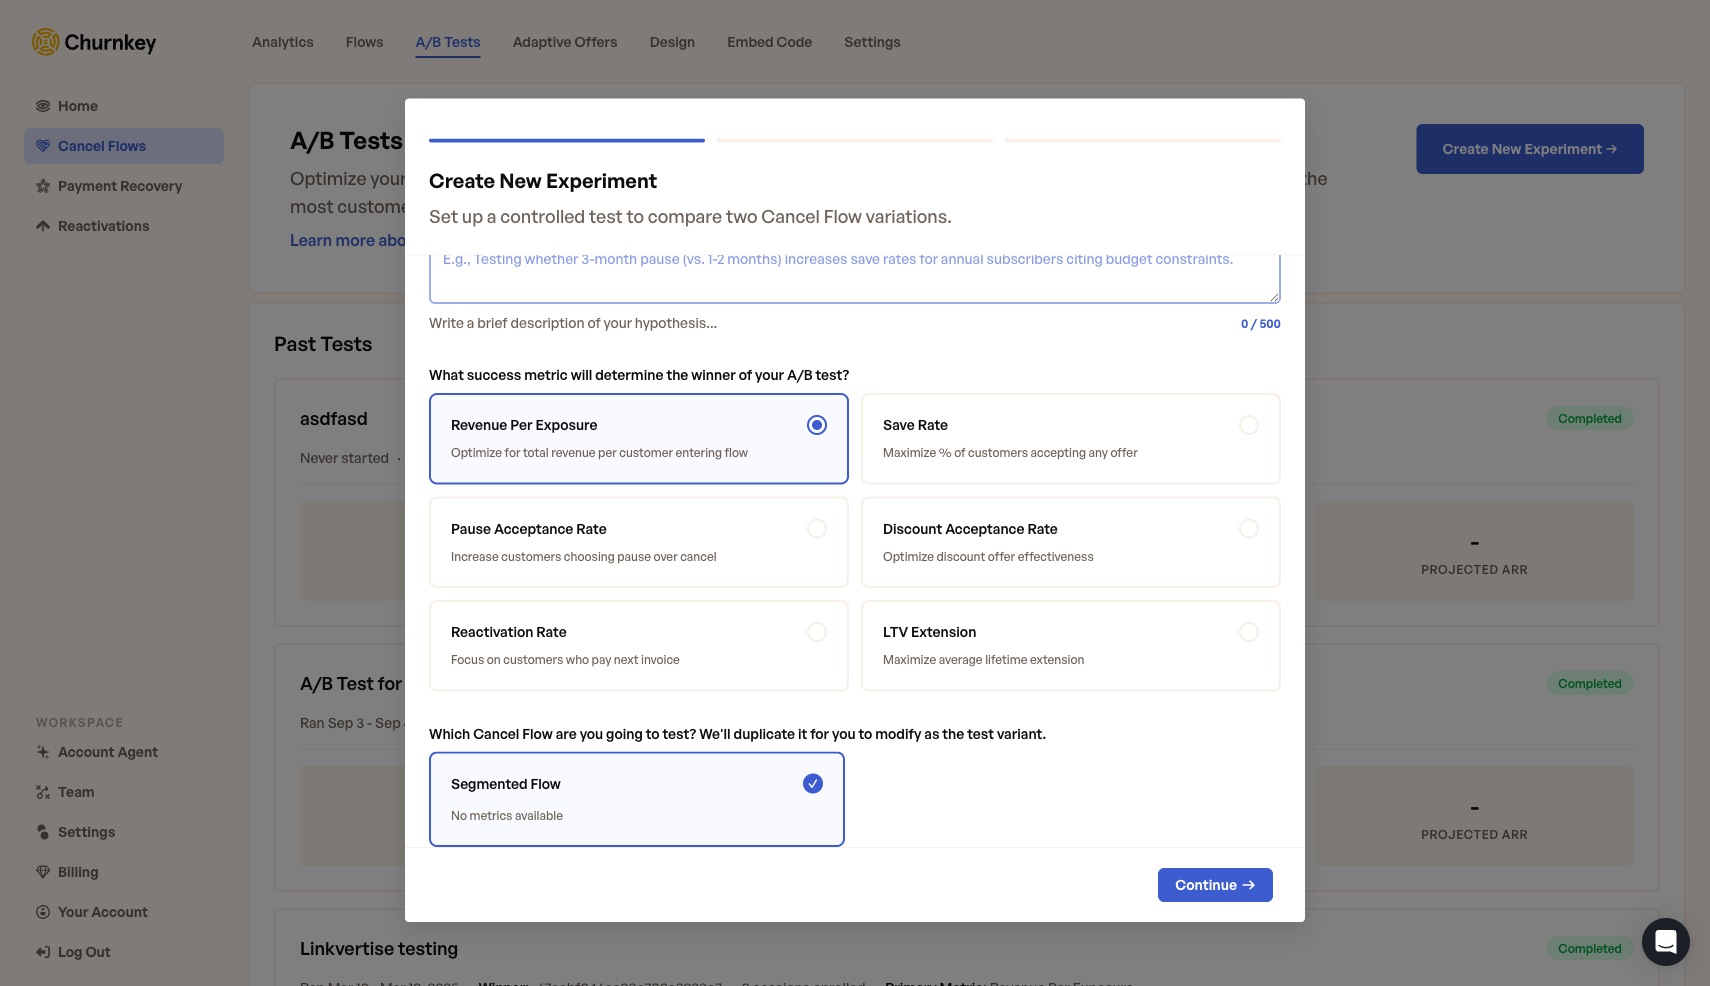
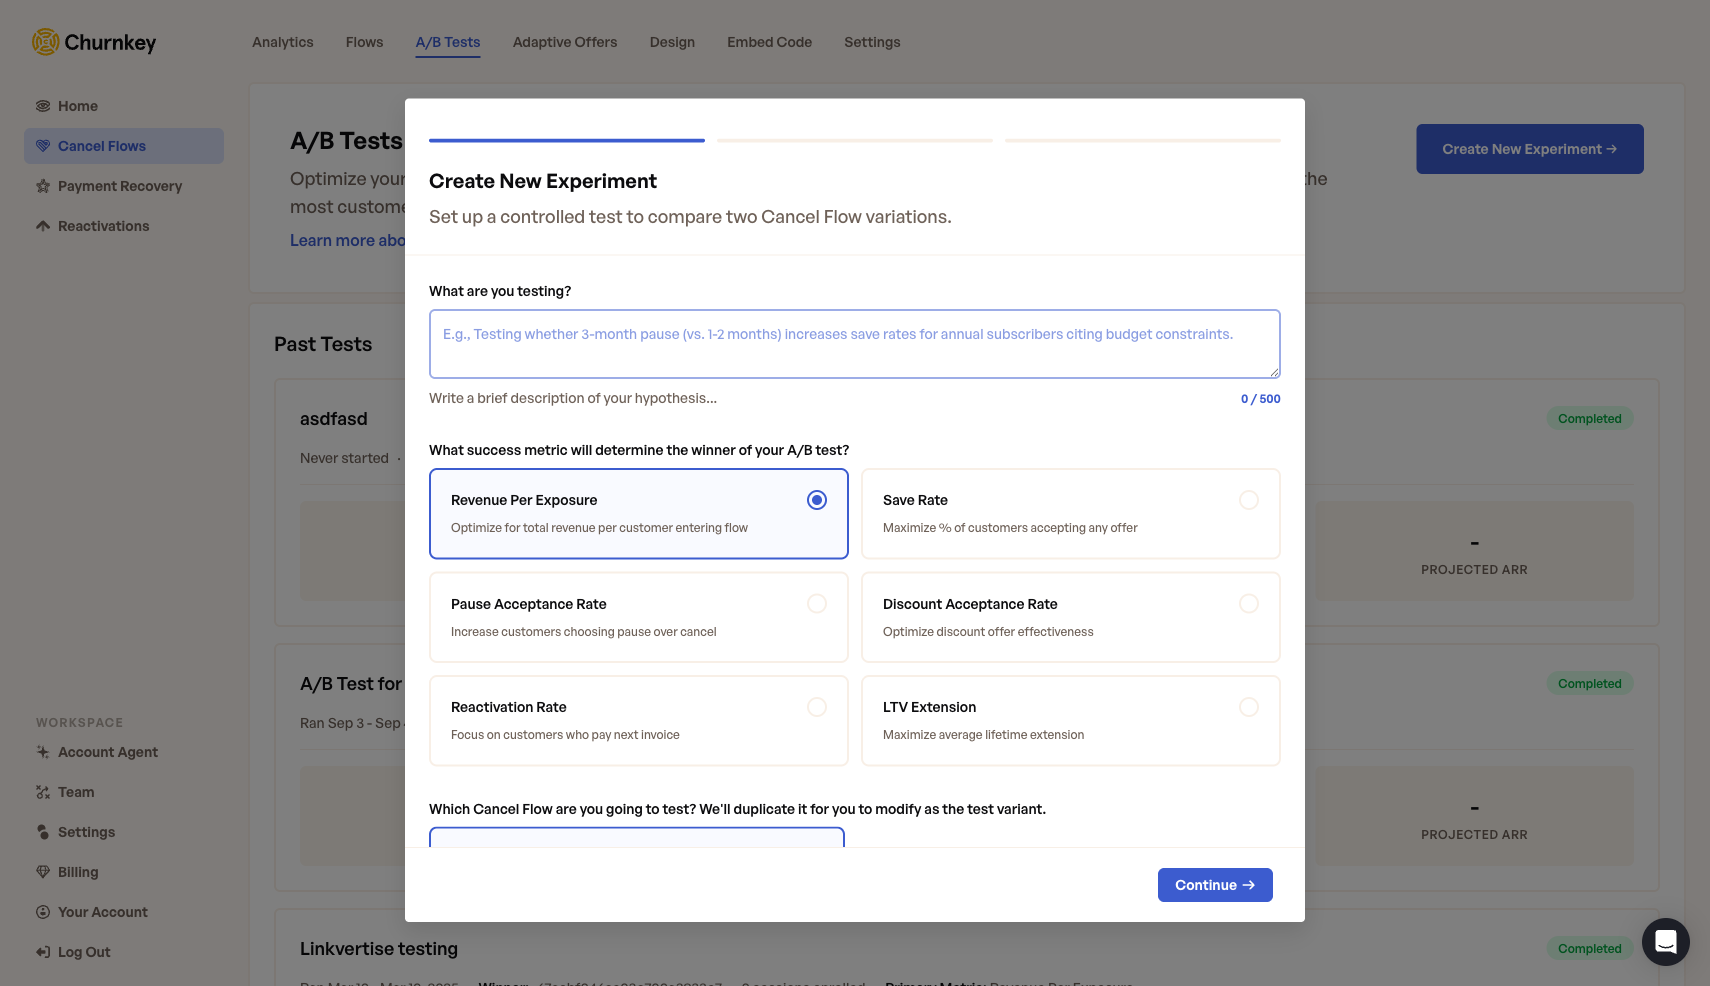
| 1. Hypothesis | Document what you're testing and why. Be specific: "Offering a 3-month pause instead of 1-month will increase save rates for annual subscribers." |
| 2. Primary Metric | Choose which metric determines the winner. Revenue Per Exposure is recommended for most tests. See Primary Metrics Reference for details on all 6 options. |
| 3. Cancel Flow | Select which segmented flow to test. Higher-volume flows reach statistical significance faster. |
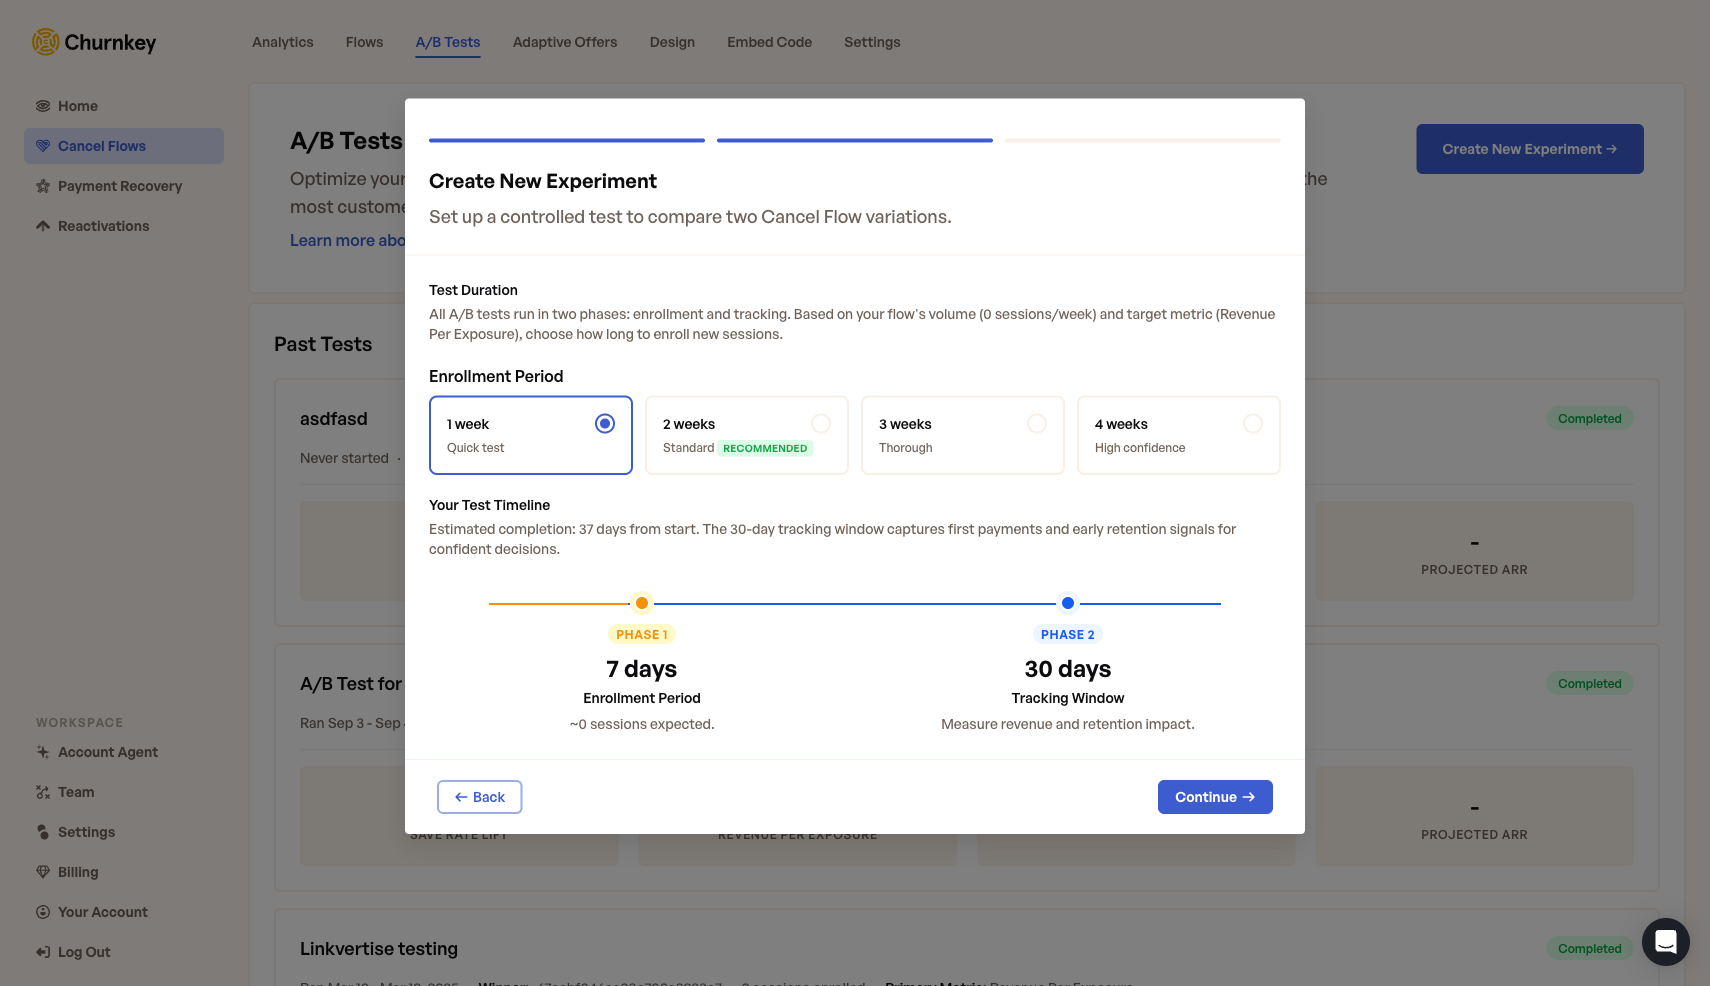
| 4. Enrollment Period | Choose how long to enroll new sessions: 1 week, 2 weeks, 3 weeks, or 4 weeks. Churnkey recommends a duration based on your flow's volume. The tracking window is always 30 days. See Choosing an Enrollment Period for details. |
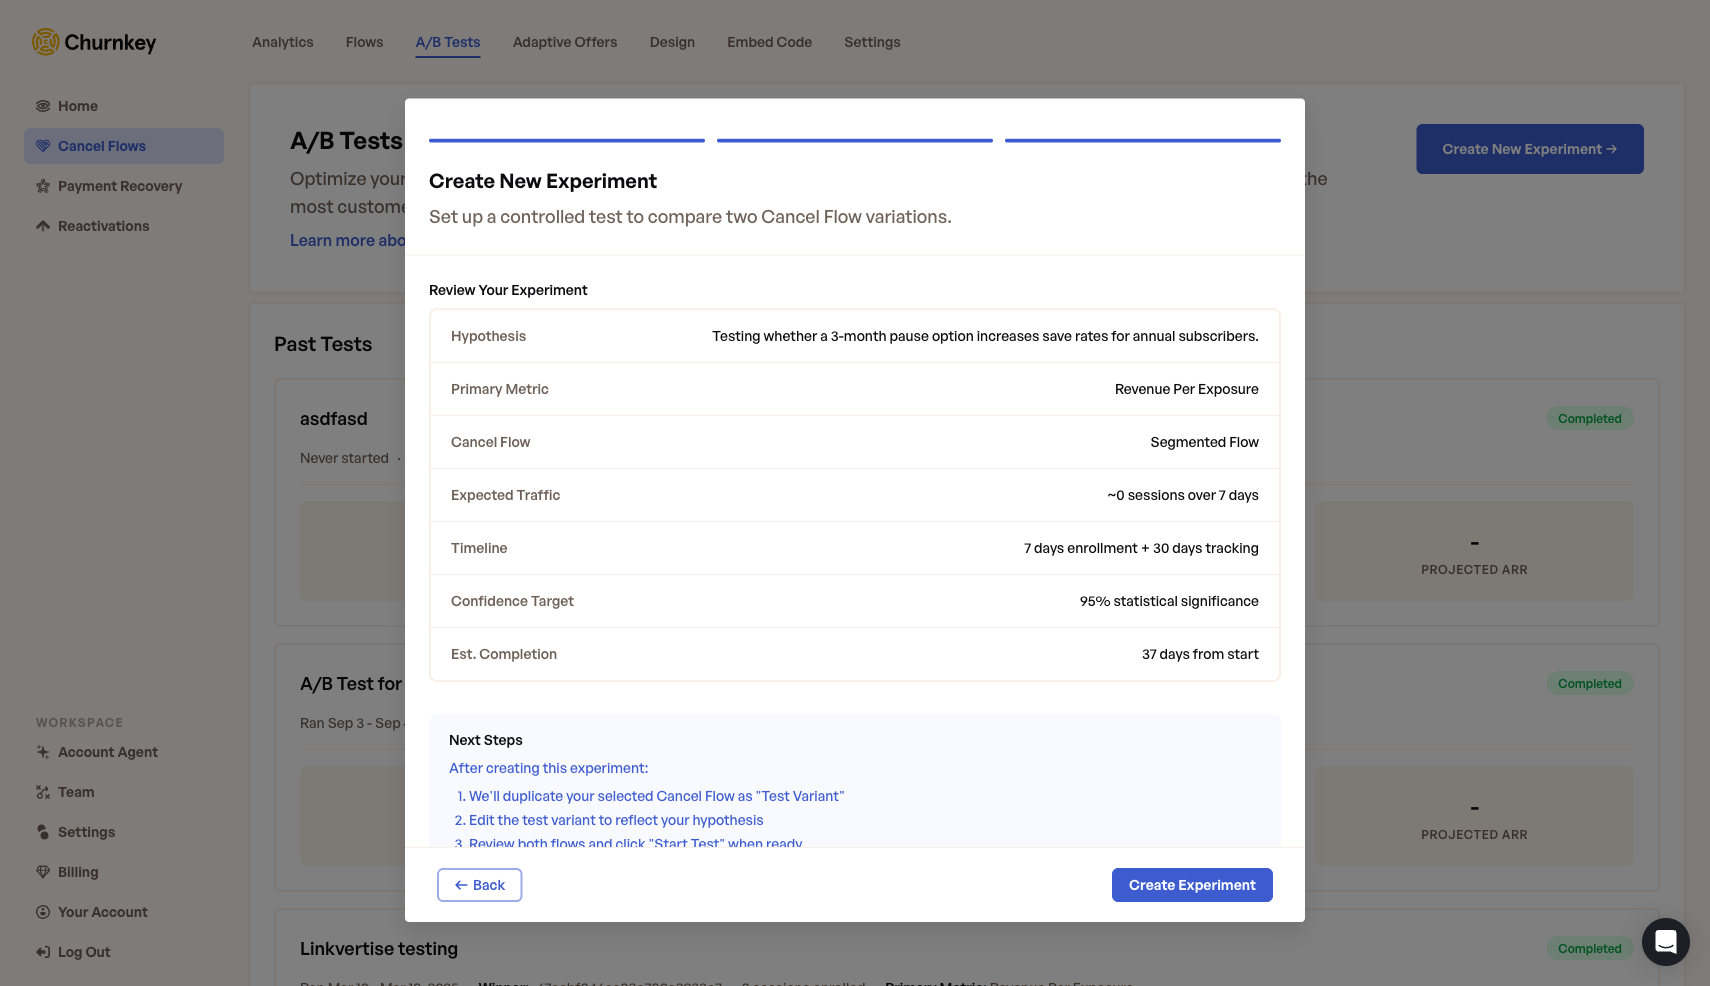
| 5. Review & Launch | Confirm settings and create the test. It starts in "Not Started" state until you click "Start." |
Step 1: Hypothesis, Metric & Flow
Step 2: Enrollment Period
Step 3: Review & Launch
Choosing an Enrollment Period
The enrollment period controls how long Churnkey splits traffic between your Control and Test variants. A longer enrollment period collects more sessions, which increases statistical confidence — but also delays your results.
Enrollment Presets
| Option | Duration | Best for |
|---|---|---|
| 1 week | 7 days | High-volume flows or testing dramatic changes |
| 2 weeks | 14 days | Most tests (default recommendation) |
| 3 weeks | 21 days | Medium-volume flows needing more data |
| 4 weeks | 28 days | Low-volume flows or detecting small differences |
How Recommendations Work
When you select a Cancel Flow, Churnkey analyzes your flow's weekly session volume and recommends an enrollment period. The goal is to collect roughly 200 sessions per variant (400 total), which provides enough data for reliable statistical analysis.
The recommended preset is highlighted with a "Recommended" badge in the enrollment selector.
The Two-Phase Timeline
Every A/B test runs in two consecutive phases, shown as a visual timeline in the setup screen:
- Phase 1 — Enrollment: New cancel sessions are split between variants for the duration you choose (7, 14, 21, or 28 days).
- Phase 2 — Tracking: No new enrollments. Churnkey monitors saved customers for 30 days to measure whether they actually stay and pay.
Total test duration = enrollment period + 30 days. For example, a 2-week enrollment results in a 44-day test.
Low Volume Warning
If your flow's expected session count during the enrollment period is below 200 total (100 per variant), Churnkey displays a warning. With low volume, only large differences between variants will be statistically significant. Small optimizations may not be detectable, and results may reflect directional trends rather than proven outcomes.
If you see this warning, consider selecting a longer enrollment period or testing on a higher-volume flow.
Primary Metrics Reference
Your primary metric determines which variant "wins." Choose based on what matters most to your business.
Revenue Per Exposure (Recommended)
- Formula:
Total Revenue from Saved Customers ÷ Total Sessions - Best for: Overall business impact—balances save rate against revenue quality
- Example: Test saves 100 customers at $10 each ($1,000). Control saves 50 at $25 each ($1,250). Control wins despite lower save rate.
Save Rate
- Formula:
Customers Saved ÷ Total Sessions × 100 - Best for: Maximizing retention count; good for testing copy, layout, or flow length
- Watch out: Can lead to over-discounting if used alone
Reactivation Rate
- Formula:
Saved Customers Who Paid Next Invoice ÷ Total Saved Customers × 100 - Best for: When saved customers frequently cancel before their next payment
- Why it matters: A customer who accepts an offer but never pays again = $0 value
Pause Acceptance Rate
- Formula:
Customers Who Accepted Pause ÷ Total Sessions × 100 - Best for: Testing pause duration, messaging, or positioning specifically
Discount Acceptance Rate
- Formula:
Customers Who Accepted Discount ÷ Total Sessions × 100 - Best for: Optimizing discount percentages, durations, or presentation
- Watch out: Higher acceptance with larger discounts might hurt revenue
LTV Extension
- Formula:
Sum of Additional Months Stayed ÷ Total Saved Customers - Best for: Long-term optimization when you have historical LTV data
- Note: Requires longer tracking periods to produce meaningful data
Reading Results
The Results Dashboard
The results dashboard shows side-by-side performance cards for Control and Test variants. Each card displays the same metrics, making it easy to compare performance directly.
The variant with better performance on your primary metric is highlighted. If the difference is statistically significant (95%+ confidence), you'll see a "Significant" badge.
Key metrics on each variant card:
| Metric | What it tells you |
|---|---|
| Sessions enrolled | Total customers assigned to this variant |
| Save rate | % accepting any retention offer |
| Revenue per exposure | Average revenue per session (your likely primary metric) |
| Reactivation rate | % of saves who paid their next invoice |
| LTV extension | Average additional months customers stayed |
Offer Breakdown
The offer breakdown shows which retention offers customers accepted in each variant:
| Offer Type | What it shows |
|---|---|
| Pause | Customers who chose to pause their subscription |
| Discount | Customers who accepted a discount offer |
| Plan Change | Customers who downgraded to a lower plan |
Compare the distribution between Control and Test to understand how customers are being saved, not just whether they're saved.
Retention Timeline
The retention timeline tracks what percentage of saved customers remain active over time (day 7, 14, 30, 60, 90). This reveals whether your saves are "sticky" or if customers churn shortly after accepting an offer.
A steep drop-off early in the timeline suggests customers are accepting offers but not genuinely retained. A flat line indicates strong long-term retention.
Expected Impact
Once results are in, the dashboard calculates the projected business impact if you roll out the winning variant:
| Metric | What it shows |
|---|---|
| Save Rate Lift | Percentage point difference between variants (e.g., +5% means Test saves 5 more customers per 100) |
| Revenue Per Exposure Difference | Dollar difference per customer entering the flow |
| ARR Impact | Projected annual recurring revenue change based on your traffic volume |
These projections help you quantify whether the improvement is worth implementing. A statistically significant result with minimal ARR impact might not justify the change.
Making a Decision
When your test reaches "Awaiting Decision," you need to analyze the results and pick a winner. This section helps you understand what the numbers mean and how to decide.
Understanding Statistical Significance
Statistical significance tells you whether the difference between variants is real or just random chance.
When you flip a coin 10 times and get 6 heads, that doesn't prove the coin is biased—it could easily happen by chance. But if you flip 1,000 times and get 600 heads, something is definitely going on. A/B testing works the same way.
| Confidence Level | What It Means | Can You Trust It? |
|---|---|---|
| 95%+ | Only 5% chance the difference is random | Yes — mathematically reliable |
| 80-94% | 6-20% chance the difference is random | Maybe — proceed with caution |
| Below 80% | High chance the difference is random | No — not statistically reliable |
Important: You can always make a decision regardless of confidence level. Low confidence doesn't prevent you from choosing—it just means there's higher risk that the "winner" isn't actually better. You're making a judgment call, not a data-driven decision.
Understanding Lift
Lift measures how much better (or worse) Test performed compared to Control, as a percentage.
Formula: Lift = (Test - Control) / Control × 100
| Control Save Rate | Test Save Rate | Lift |
|---|---|---|
| 40% | 44% | +10% |
| 40% | 48% | +20% |
| 40% | 36% | -10% |
How Sessions Affect Confidence
The smaller the improvement you're trying to detect, the more data you need. Think of it like hearing someone in a noisy room:
| Lift Size | Difficulty | Sessions Needed (per variant) |
|---|---|---|
| 20%+ lift | Like someone shouting—easy to detect | ~250 sessions |
| 10% lift | Normal conversation—need to focus | ~500 sessions |
| 5% lift | A whisper—need quiet to hear | ~1,000+ sessions |
Minimum requirement: Below 30 sessions per variant, confidence is automatically 0%. The math simply doesn't work with fewer samples.
Practical guidance based on your volume:
| Your Weekly Volume | What You Can Reliably Detect |
|---|---|
| 50 sessions/week | Only dramatic wins or losses (20%+ lift) |
| 100 sessions/week | Moderate differences (10-15% lift) |
| 250+ sessions/week | Subtle optimizations (5% lift) |
Bottom line: If you're making small tweaks expecting 5% improvements, you need a lot of data. If you're testing dramatically different approaches, you'll know faster.
The Decision Path
When evaluating your results, check these metrics in order:
Step 1: Check Statistical Confidence
- Is it 95%+? → You have reliable data to make a decision
- Is it below 95%? → Results are not mathematically reliable (see "Decision with Risk" cases below)
Step 2: Look at Your Primary Metric
- Which variant performed better on the metric you chose (e.g., Revenue Per Exposure)?
- How big is the difference? A 2% lift vs. a 20% lift have very different implications.
Step 3: Review Secondary Metrics
- Does the "winner" also perform well on other metrics?
- Watch for trade-offs: higher save rate but lower reactivation rate could mean you're saving customers who churn again quickly.
Step 4: Consider the Lift
- Positive lift = Test outperformed Control
- Negative lift = Control outperformed Test
- Near-zero lift = Both performed similarly
Decision by Case
Here are common scenarios you'll encounter and how to handle each:
Case 1: Clear Winner (High Confidence + Strong Lift)
| Metric | Control | Test |
|---|---|---|
| Sessions | 550 | 550 |
| Save Rate | 38% | 52% |
| Revenue/Exposure | $22 | $34 |
Confidence: 98% · Lift: +55%
What this means: Test dramatically outperforms Control, and you have enough data to trust this result.
Decision: Choose Test. This is the ideal outcome—clear winner with high confidence.
Case 2: Insufficient Data (Low Confidence)
| Metric | Control | Test |
|---|---|---|
| Sessions | 8 | 7 |
| Save Rate | 37.5% | 42.8% |
| Revenue/Exposure | $18 | $21 |
Confidence: 15% · Lift: +14%
What this means: Test looks better, but with only 15 sessions total, this could easily be random chance. The 15% confidence means there's an 85% probability this difference is noise.
Decision: The result is not statistically reliable. Your options:
- Choose Control (recommended) — It's your proven baseline. Don't change what works based on unreliable data.
- Choose Test anyway — If you have strong qualitative reasons to believe the changes are better, you can accept the risk.
- Run another test — Wait until you have more traffic and test again.
Case 3: Equal Performance (No Difference)
| Metric | Control | Test |
|---|---|---|
| Sessions | 500 | 500 |
| Save Rate | 45% | 45% |
| Revenue/Exposure | $25 | $25 |
Confidence: 50% · Lift: 0%
What this means: Both variants perform identically. Your changes made no measurable impact.
Decision: Choose Control. When there's no difference, stick with your original flow—it's simpler and already proven. Consider testing a more significant change next time.
Case 4: Test Performs Worse (Negative Lift)
| Metric | Control | Test |
|---|---|---|
| Sessions | 450 | 450 |
| Save Rate | 50% | 30% |
| Revenue/Exposure | $30 | $18 |
Confidence: 99% · Lift: -40%
What this means: Your changes hurt performance. Control is significantly better, and the high confidence means this is definitely real, not random.
Decision: Choose Control. Your hypothesis was wrong—the test variant made things worse. This is still a valuable learning: you now know what doesn't work.
Case 5: High Volume, Small Difference
| Metric | Control | Test |
|---|---|---|
| Sessions | 5,500 | 5,500 |
| Save Rate | 43% | 46% |
| Revenue/Exposure | $24 | $27 |
Confidence: 97% · Lift: +12%
What this means: Test is better, and with 11,000 total sessions you can trust this result. However, the improvement is modest (3 percentage points on save rate).
Decision: Choose Test. Even small improvements compound over time. A 3% save rate increase across thousands of customers adds up to significant revenue.
Case 6: Missing Data (Technical Issue)
| Metric | Control | Test |
|---|---|---|
| Sessions | 300 | 0 |
| Save Rate | 42% | — |
| Revenue/Exposure | $26 | — |
Confidence: N/A · Lift: N/A
What this means: Something went wrong. Test variant received no traffic—possibly a configuration error, broken flow, or technical issue.
Decision: Choose Control (you have no choice). Investigate why Test got no sessions before running another test. Check that the Test variant is published and active.
Document Your Rationale
Use the rationale field to record why you chose this winner. Good documentation helps your team understand past decisions.
Examples:
- "Test showed 55% revenue lift with 98% confidence. Clear winner."
- "Only 15 sessions enrolled. Choosing Control due to insufficient data."
- "Test performed 40% worse. Reverting to Control."
- "Small 3% lift but high confidence. Choosing Test for incremental gains."
What Happens After Confirmation
When you confirm your decision:
- The winning variant goes live immediately for all future customers in this segment
- The losing variant is deactivated but preserved for reference
- The test moves to your completed tests history
FAQs
Can I test my primary Cancel Flow? No. A/B tests require segmented Cancel Flows because the primary flow serves as the fallback for all customers who don't match segment criteria.
Can I run multiple tests at once? Yes, as long as they test different segments with non-overlapping customer populations.
What happens if I need to edit a variant during the test? Technically possible, but strongly discouraged. It invalidates results because customers before and after the change experienced different flows.
Can I pause a test? Yes. Pausing stops new enrollments. You can resume later, but enrollment restarts from zero.
How do I see which variant a specific customer saw? Check the Exposure Stream section in the test results page.
Why can't I see final results immediately? The 30-day tracking period ensures we measure actual retention, not just initial offer acceptance. Without it, you'd optimize for people who say "yes" but churn anyway.
What happens to the losing variant's enrolled users? Nothing changes for them. The test measures what happened; it doesn't retroactively change anyone's experience.